different applications and sample volumes.
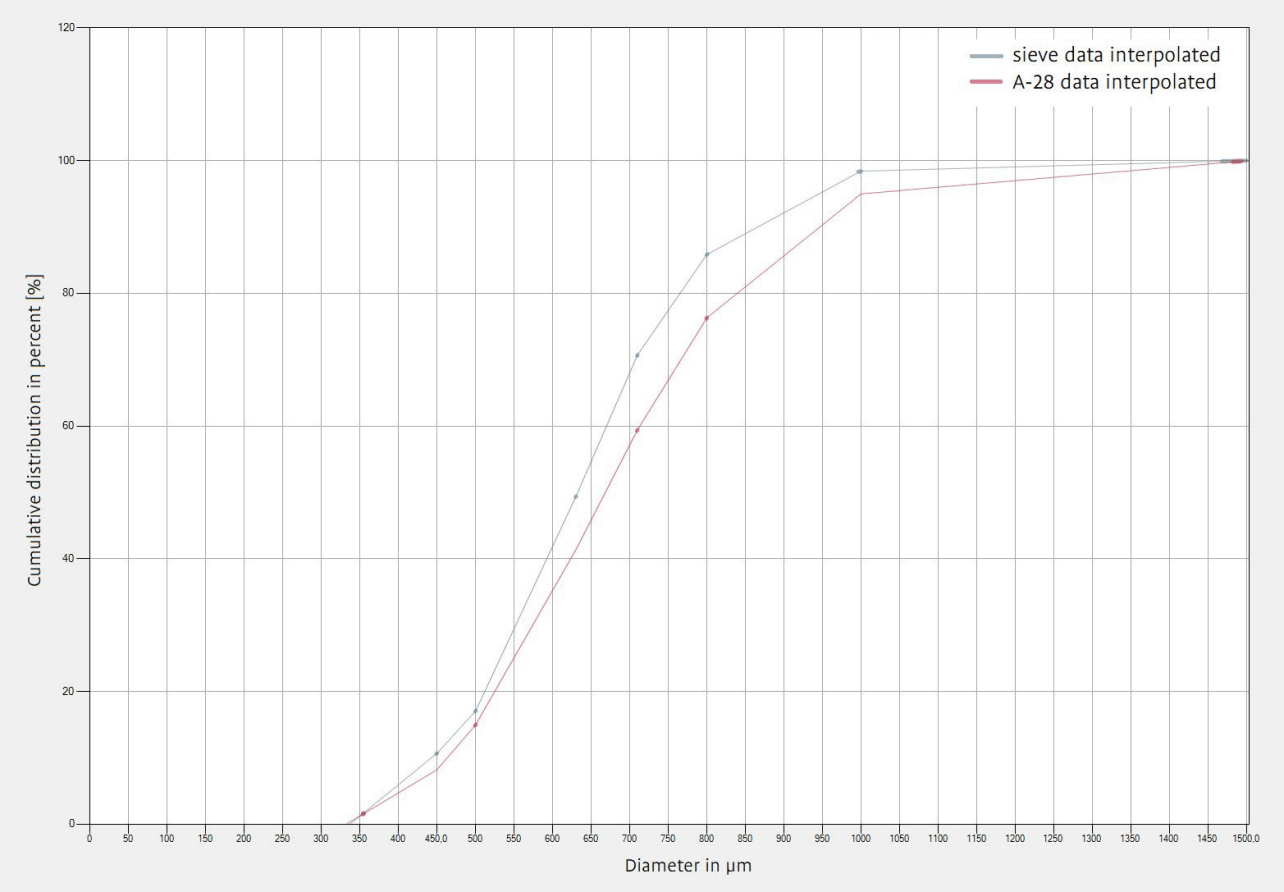
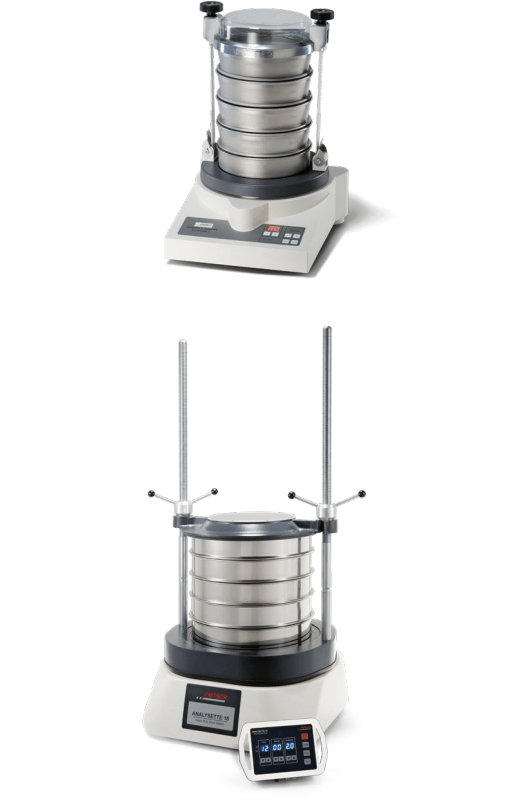
Sieve analysis is based on the mechanical separation of particles using sieves with defined mesh sizes. Depending on the method, the particles are guided through the sieve openings by gravity, vibration or an air stream. The mass of the particle fractions retained on the individual sieves is weighed and visualized as a cumulative particle size distribution (see figure 1). There are various processes that differ in terms of the type of movement and the separation principle used. With vertical sieving, the particles are repeatedly transported upwards, allowing them to be optimally channeled through the mesh openings. This process is particularly suitable for dry, non-sticky materials. To increase efficiency and prevent blockages, so-called sieving aids in the form of ceramic or polymer balls are often used. These keep the sieve openings clear by loosening the material and allowing better passage. Care must be taken to ensure that the balls do not actively crush the particles. In contrast, with horizontal sieving, the particles move parallel to the surface. This method is often used for sensitive or brittle materials, as it enables gentle separation. Another method is air jet sieving, in which a targeted stream of air transports fine particles through the mesh. This process is particularly suitable for very fine or adhesive powders, as it reduces clogging and ensures more precise separation. For very fine or cohesive particles, wet sieving can also be carried out using e.g. water as a carrier liquid. This improves the separation efficiency and prevents fine particles from sticking.
Despite its ease of use, sieve analysis has various disadvantages that can affect the accuracy and reproducibility of the measurement results. One major problem is the limited resolution and classification, as the method works with firmly defined sieve openings. As a result, the particle size distribution can only be recorded discretely, meaning that it is not possible to precisely determine the actual particle size between two sieve stages. Another disadvantage concerns the misclassification of non-spherical particles. As the sieve analysis assumes an equivalent spherical size, elongated, fibrous or platelet-shaped particles can lie crosswise and thus ‘simulate’ a larger particle size. Conversely, they can fall through smaller sieve openings in an unfavorable orientation, which impairs the measurement accuracy. In addition, agglomeration and electrostatic effects can falsify the results. Particularly fine or moist particles tend to clump together or stick to sieve meshes and other particles. Electrostatic charges intensify this effect and can make it more difficult to separate the particles. Mechanical wear and ageing of the sieves are also problematic. Repeated loading can cause the sieve openings to become deformed or clogged, leading to measurement deviations. Regular calibration and timely replacement of the sieves are therefore essential. However, even brand-new sieves are subject to errors that can be attributed to the mesh size tolerances in accordance with ISO 3310-1. For example, deviations of more than 3 % of the average real width and more than 15 % deviation of an individual mesh from the nominal value are allowed. Furthermore, sieve analysis requires a great deal of measuring effort. Compared to modern methods such as dynamic image analysis, sieving is time-consuming, especially if the fractions must be weighed and analyzed manually. In this context, the human factor itself must also be identified as one of the main sources of error: Inconsistencies can already occur during sample preparation if the sampling is not representative, or the material is insufficiently mixed. Errors are also possible during the sieving process: overloading the sieves can significantly distort the sieving result, as an excessively high particle layer can block individual sieve meshes and reduce the efficiency of the separation. Short sieving times also lead to inaccurate separations, while different sieve movements (vertical or horizontal) influence the result as well. Another critical point is the weighing of the fractions. Inaccurately tared scales or losses due to unclean decanting falsify the measurement. The interpretation of the results also plays a role: incorrect calculations of the cumulative particle size distribution or incorrect assumptions about the particle shape can lead to misjudgments. Finally, the cleaning, maintenance and calibration of the sieves also influence the measurement results. Worn or deformed sieve cloths are often not replaced in time and clogged sieves can provide incorrect measured values. All these factors significantly influence the reproducibility and accuracy of sieve analysis and make it clear that sieve analysis, despite its established application, has limitations that can be overcome by modern, standardized analysis methods and lead to more reliable results.
Dynamic image analysis in accordance with ISO 13322 is established in numerous branches of industry and utilizes highspeed cameras and powerful image processing algorithms to precisely determine particle size and shape. The particles are transported in a flowing liquid or gas phase and illuminated within a measuring chamber. The camera captures the shadow projection, from which various size and shape parameters are analyzed. In addition to the particle size distribution, shape characteristics such as aspect ratio, sphericity and convexity can also be determined.
With the A-28 particle analyzer from FRITSCH, over one million particles can be quickly recorded and classified in realtime and at a recording speed of up to 75 images per second (see figure 2). Compared to classic sieve analysis, optical particle analysis enables significantly faster measurement, typically with sample quantities of 10 to 50 g and an analysis time of only around five minutes. The tool-free cleaning also saves additional time. Thanks to a resolution of up to 2.5 µm and the ability to subdivide the particles into up to 1000 size classes, the A-28 achieves exceptionally high measurement accuracy. The data obtained can be visualized with 23 different size and shape parameters in the software at the click of a mouse and correlated with each other to analyze specific relationships between particle shape and size. The measurement is fully automated using predefined standard operating procedures (SOP´s), which eliminate operating errors. Intelligent algorithms take over the subsequent data evaluation and prevent individual calculation errors. Thanks to the advanced design of the A-28, the system is maintenance-free and requires no replacement of wearing parts.
When comparing the data from sieve analysis and dynamic image analysis, considerable deviations often occur. One of the main reasons for this is the ambiguous definition of particle size. While it can be clearly determined for perfect spherical particles, different size parameters such as Feret diameter, equivalent diameter or chord length must be clearly differentiated for irregularly shaped particles. As different parameters can be used as the basis for the particle size distribution, the measurement results will vary accordingly.
A suitable parameter must therefore be selected for a meaningful comparison with sieve data. Experience has shown that the minimum chord length provides the best agreement with the sieve results, as particles generally pass through the sieve with their smallest projection area. Spherical particles, such as glass microspheres, metal powders -produced by gas or plasma atomization- or latex standards, represent the simplest case, as their measured size remains independent of the orientation. Nevertheless, even with perfectly spherical particles, the results of dynamic image analysis deviate from those of sieving. The main causes are the deviation of the real sieve mesh size from the nominal opening and human error during sieving, as discussed previously.
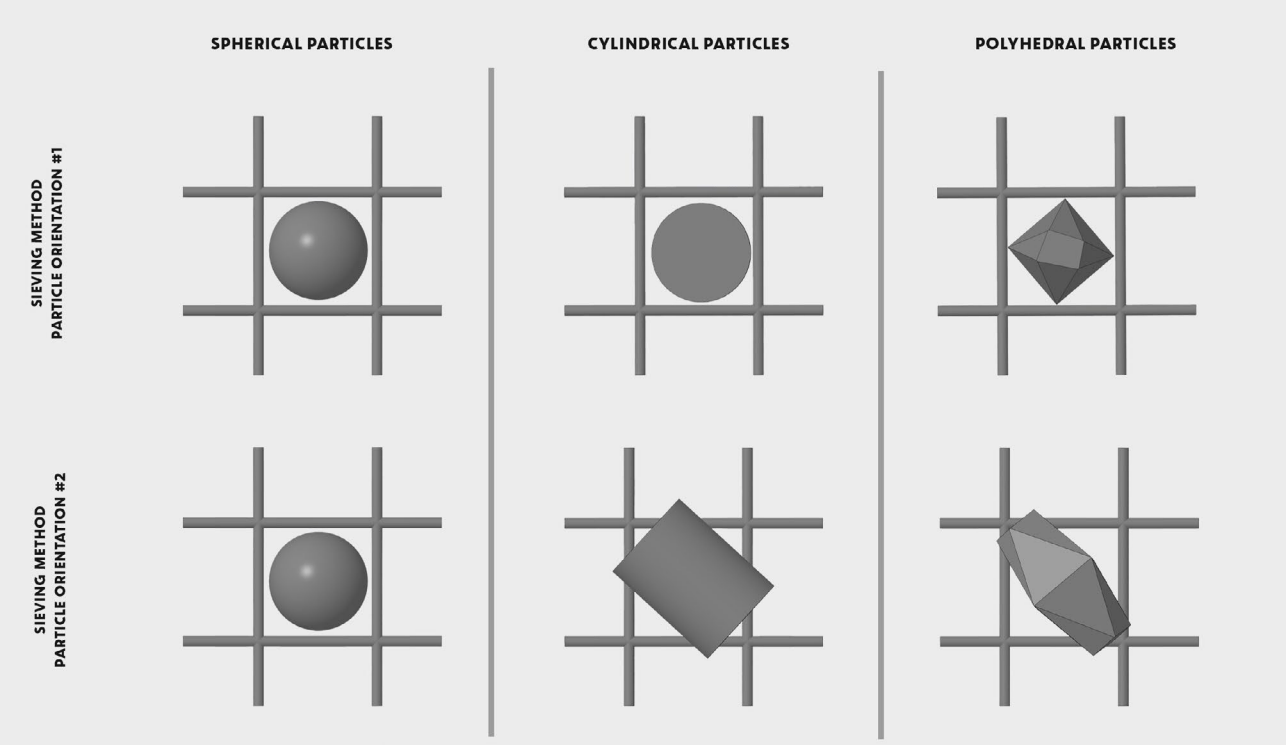
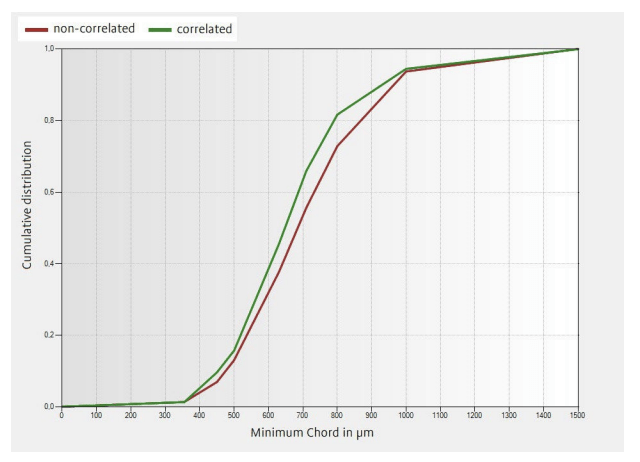
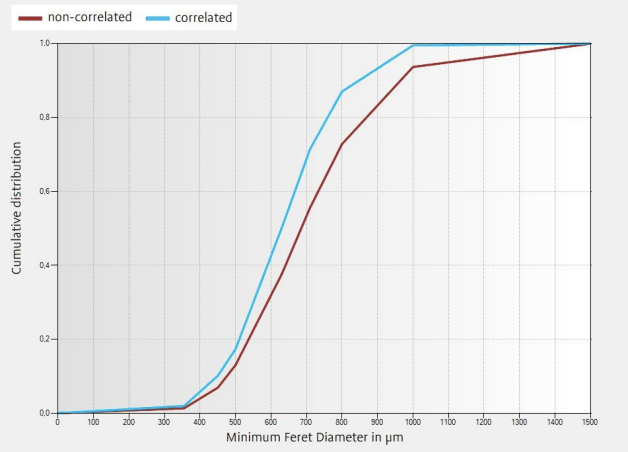
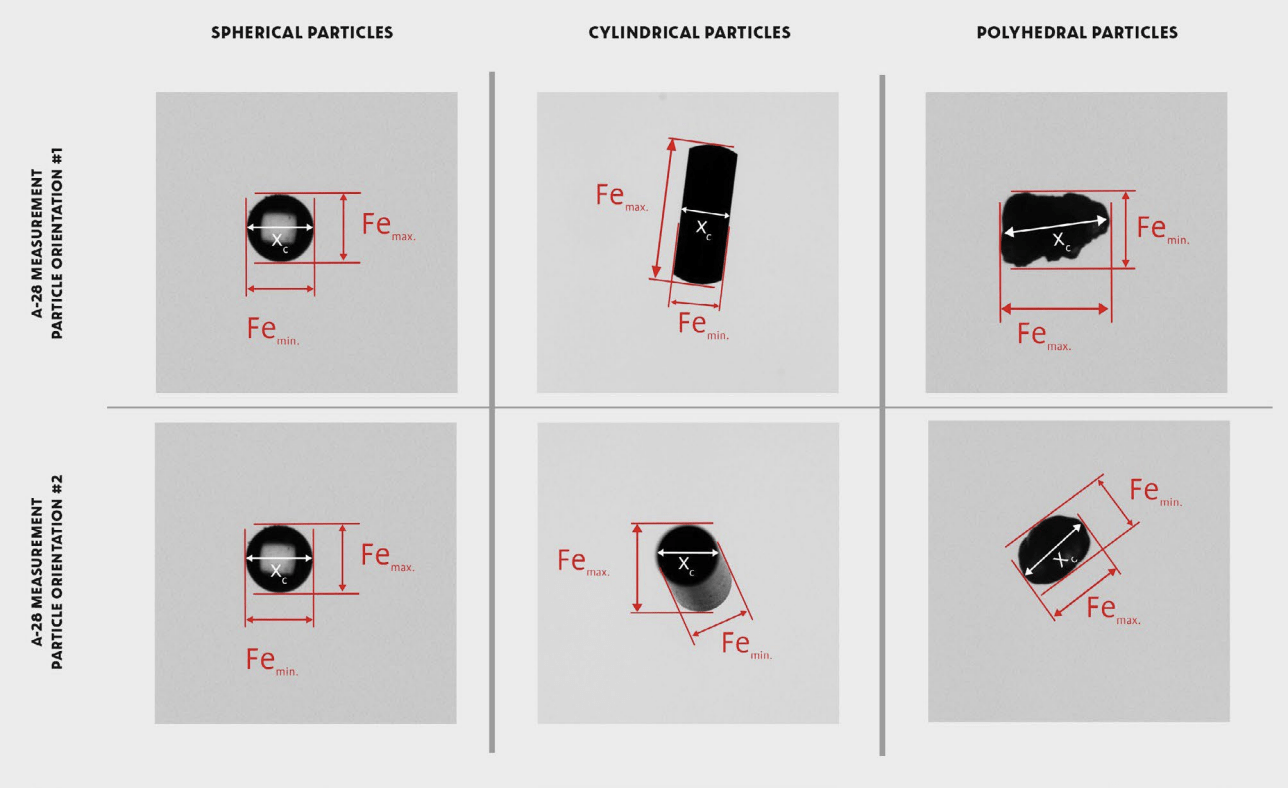
The differences become even clearer with irregularly shaped particles, where systematic deviations between the two methods occur. These differences result primarily from the underlying particle shape. Typical particle shapes are cylindrical, polyhedral or platelet-shaped particles which, depending on their orientation, find different paths through the square sieve meshes or are captured by the dynamic image analysis camera in different orientations. Cylindrical particles -such as extruded plastic granules, animal feed, fertilizers or pharmaceutical pellets- can pass through the sieve either in their diameter or their length, which leads to varying measurement results. The same applies to optical analysis. Plateletshaped particles – such as graphite particles, aluminum flakes, e.g. for effect paints, mica fragments or cellulose flakes, e.g. in composite materials, exhibit similar behavior and tend to orient themselves diagonally. As a result, their measured size can vary both in the direction of thickness and diameter. In dynamic image analysis, the minimum chord length can be larger or smaller than the sieving result, depending on the particle orientation. However, experience has shown that the measured particle size distribution in image analysis is wider than in sieving. Polyhedral (angular) particles – typically found in building materials and metallurgy, for example in quartz, ceramic or metal powders, e.g. aluminum oxide, silicon carbide or copper, as well as in salt and sugar granulates, can also pass through the sieve meshes in a variety of ways. Ideally, a sieve can at most capture the real edge length of the polyhedron. A cube, for example, can either fit exactly through the sieve mesh or – more likely – block it. In dynamic image analysis, on the other hand, measured values can lie between the actual edge length and the maximum spatial diagonal. In the case of a cube, the deviations can be up to √2 times the edge length (see figures 3 and 4).
In general, samples with a broad particle size distribution show smaller deviations between sieving and image analysis than samples with a narrow distribution. In unguided samples, the particles are randomly orientated so that some particles appear larger or smaller depending on their orientation. With broad distributions, these differences largely cancel each other out, whereas they are more significant with narrow distributions. This requires different corrections for different samples. This knowledge is crucial to ensure reliable and comparable particle size analyses.
Importantly, as both measurement techniques suffer from individual measurement errors, only the A-28 can perform postdata processing. By applying suitable filters within the software, wrongly orientated particles can be identified and eliminated from the data set, improving the quality of the results tremendously.
Due to the different effects of the particle shape, the A-28 software offers two approaches for correlating the sieve data: simple sieve correlation and complex sieve correlation. Both methods are easy to create and to be used as both methods are based on the same principle: First, a correlation function is created based on actual sieve data and A-28 analysis data of the same sample (see figure 5). This function can then be applied to future A-28 analysis data for comparable samples to simulate sieve values. This allows, for example, a comparison with previously performed sieve analyses of other batches.
The simple sieve correlation is particularly suitable for spherical particles (see figure 6). It is primarily based on a simple parallel shift of the particle size distribution -either along the ordinate or the abscissa. To create a simple sieve correlation, only the sieve data and the A-28 analysis data of the entire sample are required. In addition to the minimum chord length, other size parameters can also be used as a basis for calculation to ensure comparability. The quality of the match can be checked using a graphical representation and the calculation parameter can be adjusted if necessary.
A simple shift is not sufficient for non-spherical particles, as the differences between dynamic image analysis and sieving depend heavily on the particle shape. In this case, the complex sieve correlation is used (see figure 7). This is based on individually calculated correction factors that are adapted for each particle class of the sieve analysis. In addition to the sieve data and the A-28 analysis data of the entire sample, the A-28 analysis data of the individual sieve fractions are also required to create the correlation. Here too, the calculation parameter can be varied, and the quality of the correlation can be checked. As the correlation takes each sieve fraction into account, the underlying algorithm offers significantly higher accuracy and robustness than methods that only use a single fraction for adjustment.